Metrics predates autoscaling. Its headline, its capacity measure and its hosting advice all assume a fixed lineup that operators change by hand. On the current fleet, with T5 and T6 policies covering every map (1–3 lobbies, 1 empty spare), they show no data, read as failure, or give advice that can't be followed.
All lobbies full never has data and tests the wrong thing:
worker.ts:374 takes capacity only from sv_maxclients in an RCON reply (rcon.ts:423,558-563). Live replies don't include it: t5_zombie_theater_1 had 2 players and a clean RCON reply with pings, and its capacity was null.
worker.ts:335 skips RCON when the telemetry roster is empty, and fleet/metrics.ts:271-285 only counts a map when every lobby on it has a capacity. Autoscaling always keeps an empty spare, so this would fail even if the parsing worked.
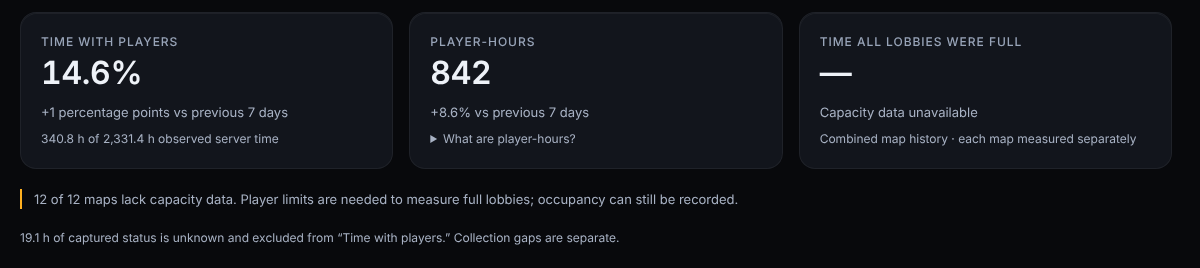
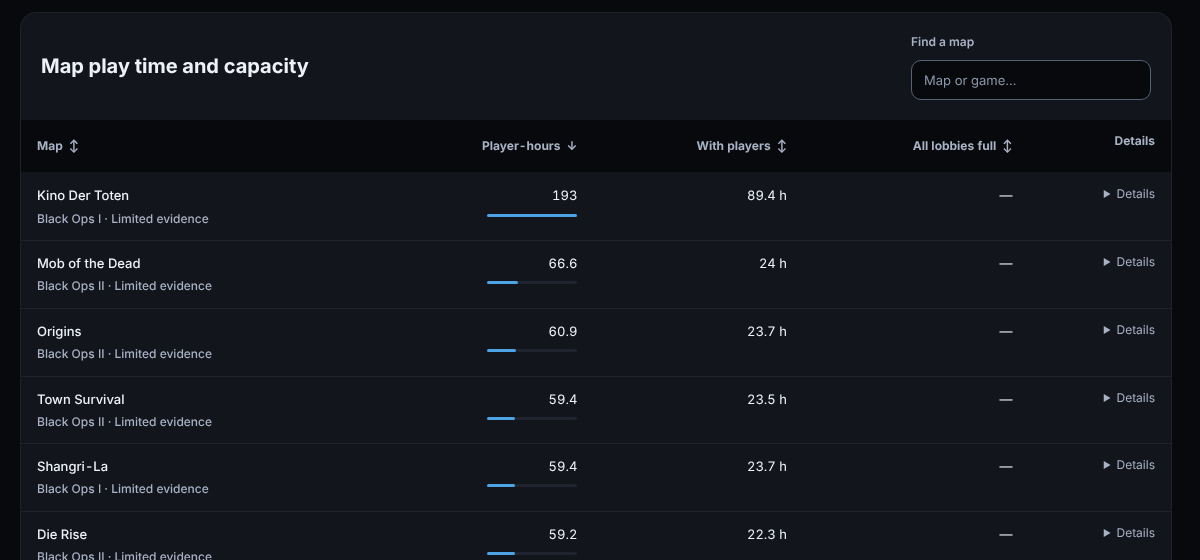
The live report has 0 known-capacity map-hours across 19 maps for 24 hours, 7 days and 30 days. The card (MetricsSummary.svelte:69-82) always shows "—", and every map row says "Limited evidence" (MetricsTables.svelte:228).
autoscaling.md:3 says a partly occupied Zombies lobby isn't a spare, so "players ≥ max clients" doesn't measure whether a new group can find a lobby.
fixture-data.ts:373 writes capacity 4 on every sample, so the preview hides all of this.
Hosting insights give advice that autoscaling makes impossible or redundant:
metricRecommendations (metrics-insights.ts:25) only sees map totals, never policies. On live, 18 of 19 maps get "Trial less idle hosting… Review one idle lobby" (metrics-insights.ts:80-91) and the other gets "Check capacity during busy hours".
Each of those quiet maps runs the one lobby its policy requires, and autoscaling.md:36 says manual Destroy is rejected while a policy is live. "Trial one additional lobby" (metrics-insights.ts:61-69) is what autoscaling already does.
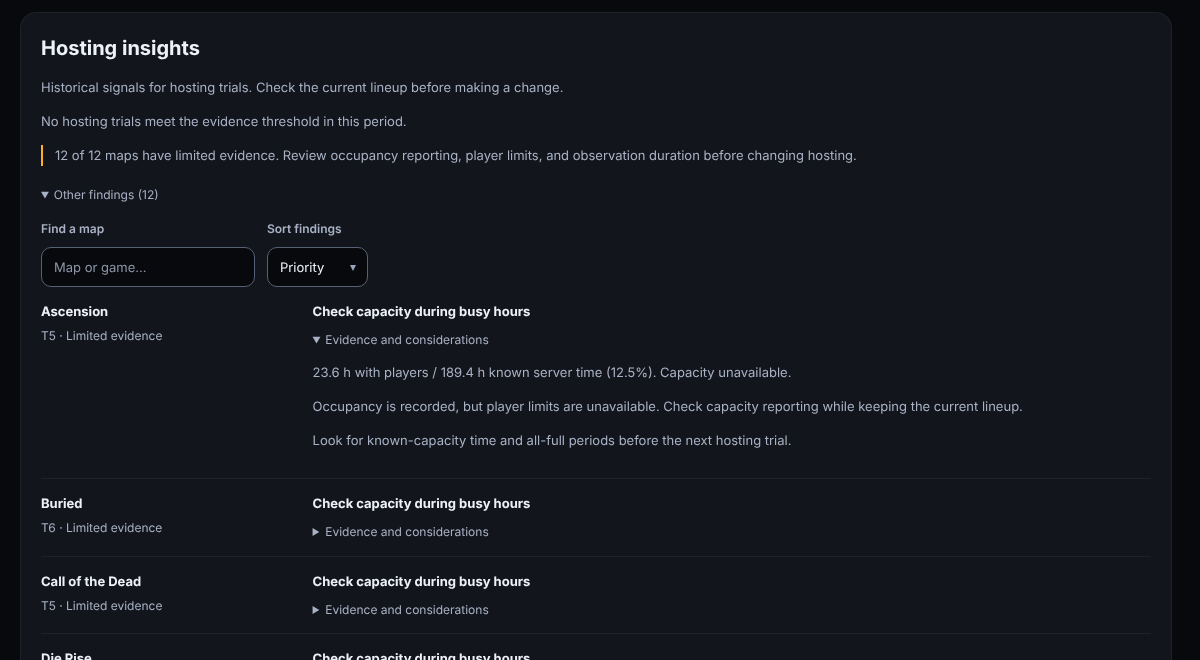
Missing capacity makes every suggestion tentative, so the panel always says "No hosting trials meet the evidence threshold" (MetricsExplore.svelte:67-68) and the advice sits under "Other findings".
metrics.md:44-79 still describes "Explore this period", "Map capacity pressure" and "Hosting experiments", none of which exist on the page.
"Time with players" penalises the spares autoscaling keeps on purpose:
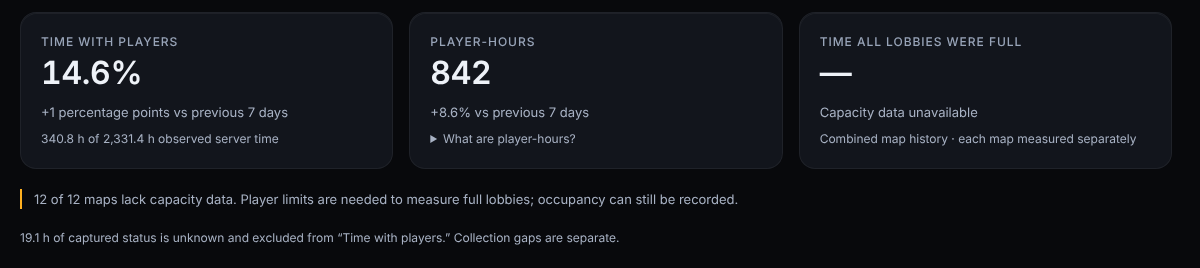
The headline (MetricsSummary.svelte:33-49) is occupied ÷ known server time. On live it reads 3.8% (89.1 h of 2,317 h over 7 days), because 2,228 h of 2,553 lobby-hours (87%) were spares waiting for a group.
autoscaling.md:76 already warns that this figure "can rise simply because idle lobbies leave its denominator". It follows policy settings, not how well players were served.
The timeline defaults to a 100% share (MetricsChart.svelte:24-26, metrics.md:25-28), so changes in lobby count don't show.
Together these leave the page unable to answer the questions in #35, such as how often a map had demand and no supply.
Screenshots
The preview's samples were replayed through the autoscaling rules (min 1, max 3, 1 spare, 15-minute empty interval) with capacity recorded as null, as production records it. The fixture also has game-wide T5 and T6 policies, like live.
Before, summary cards:
After (mockup), empty lobby available:
Before, maps table:
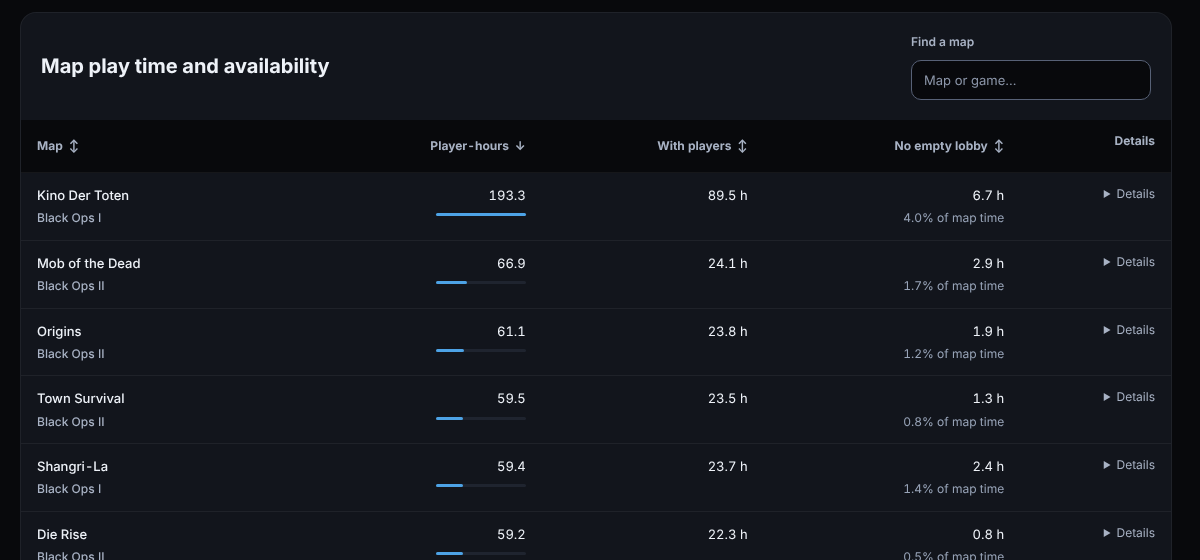
After (mockup), no empty lobby column:
Before, Hosting insights:
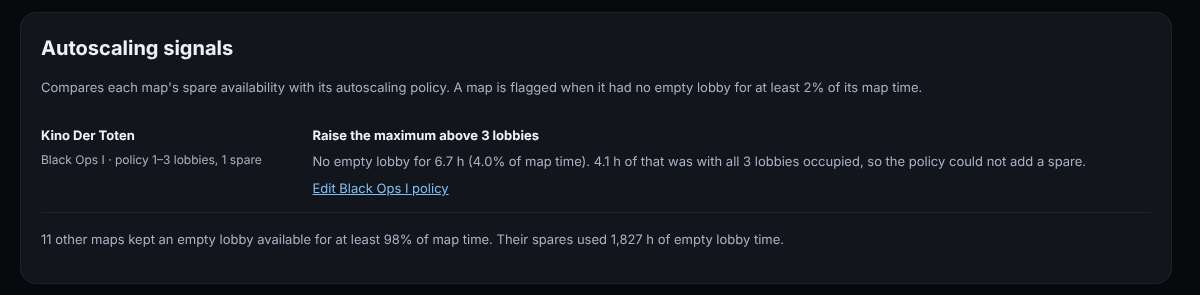
After (mockup), autoscaling signals:
Before, headline:
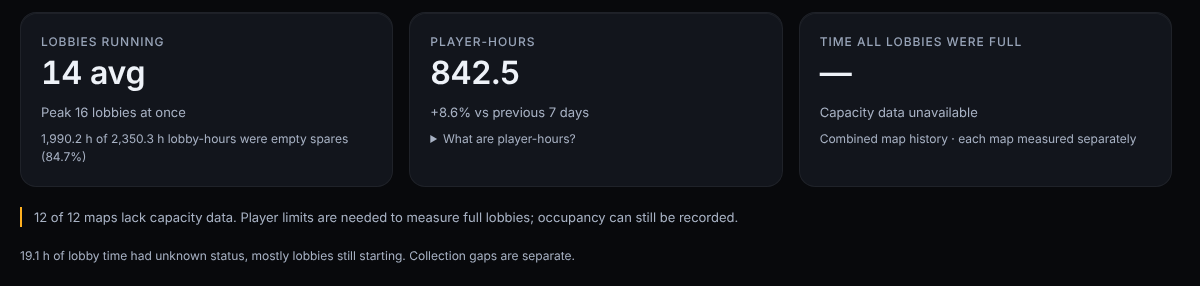
After (mockup), lobbies running:
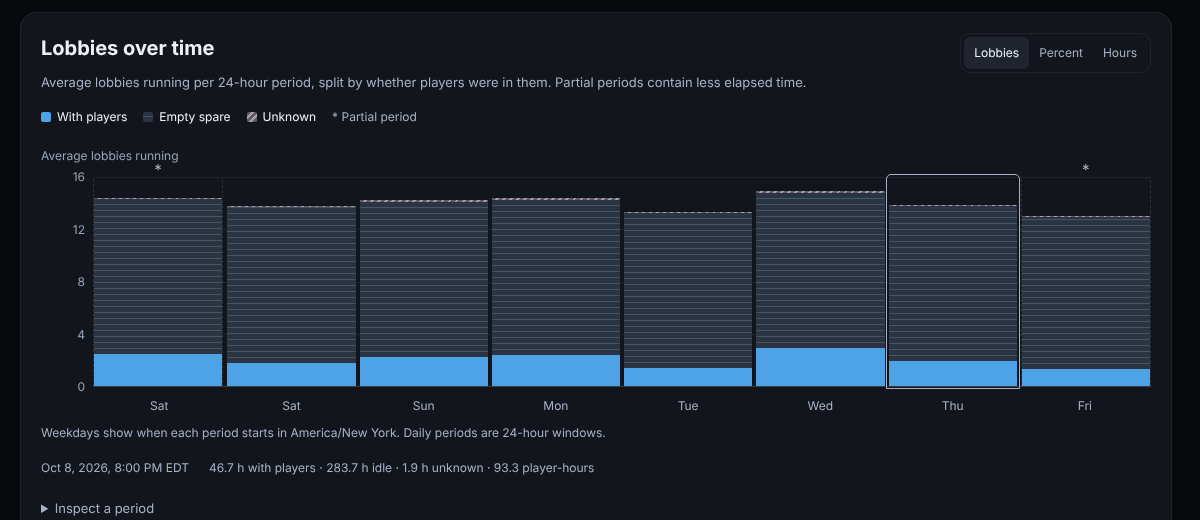
Before, timeline:
After (mockup), lobbies over time:
Fix
Replace "Time all lobbies were full" (card, maps column and details) with time with no empty lobby per map: collections where no lobby on that game/map reported zero players, worked out from occupancy alone
Count a map whose lobbies are all unknown as unknown, not as short of a spare
Stop marking maps "Limited evidence" and suggestions tentative because capacity is missing (MetricsTables.svelte:228, metrics-insights.ts:40-44), and remove the "lack capacity data" notice (MetricsSummary.svelte:87-90)
Replace Hosting insights with policy-aware signals: no empty lobby at the policy maximum suggests raising the maximum, and below it suggests raising the spare target or checking create time, each linking to the policy
For maps without a policy, suggest adding one instead of a manual lineup trial
Replace the "Time with players" card with lobbies running (average and peak) and the share of lobby-hours that were empty spares
Default the timeline to average lobbies running, split into with players, empty spare and unknown
Rewrite metrics.md (overview, timeline, comparisons and hosting experiments, capacity) and the About text (+page.svelte:372-389) to match
Remove the hard-coded capacity from the fixture's samples (fixture-data.ts:373)
Metrics predates autoscaling. Its headline, its capacity measure and its hosting advice all assume a fixed lineup that operators change by hand. On the current fleet, with T5 and T6 policies covering every map (1–3 lobbies, 1 empty spare), they show no data, read as failure, or give advice that can't be followed.
All lobbies full never has data and tests the wrong thing:
- `worker.ts:374` takes capacity only from `sv_maxclients` in an RCON reply (`rcon.ts:423,558-563`). Live replies don't include it: `t5_zombie_theater_1` had 2 players and a clean RCON reply with pings, and its `capacity` was null.
- `worker.ts:335` skips RCON when the telemetry roster is empty, and `fleet/metrics.ts:271-285` only counts a map when every lobby on it has a capacity. Autoscaling always keeps an empty spare, so this would fail even if the parsing worked.
- The live report has 0 known-capacity map-hours across 19 maps for 24 hours, 7 days and 30 days. The card (`MetricsSummary.svelte:69-82`) always shows "—", and every map row says "Limited evidence" (`MetricsTables.svelte:228`).
- `autoscaling.md:3` says a partly occupied Zombies lobby isn't a spare, so "players ≥ max clients" doesn't measure whether a new group can find a lobby.
- `fixture-data.ts:373` writes capacity 4 on every sample, so the preview hides all of this.
Hosting insights give advice that autoscaling makes impossible or redundant:
- `metricRecommendations` (`metrics-insights.ts:25`) only sees map totals, never policies. On live, 18 of 19 maps get "Trial less idle hosting… Review one idle lobby" (`metrics-insights.ts:80-91`) and the other gets "Check capacity during busy hours".
- Each of those quiet maps runs the one lobby its policy requires, and `autoscaling.md:36` says manual Destroy is rejected while a policy is live. "Trial one additional lobby" (`metrics-insights.ts:61-69`) is what autoscaling already does.
- Missing capacity makes every suggestion tentative, so the panel always says "No hosting trials meet the evidence threshold" (`MetricsExplore.svelte:67-68`) and the advice sits under "Other findings".
- `metrics.md:44-79` still describes "Explore this period", "Map capacity pressure" and "Hosting experiments", none of which exist on the page.
"Time with players" penalises the spares autoscaling keeps on purpose:
- The headline (`MetricsSummary.svelte:33-49`) is occupied ÷ known server time. On live it reads 3.8% (89.1 h of 2,317 h over 7 days), because 2,228 h of 2,553 lobby-hours (87%) were spares waiting for a group.
- `autoscaling.md:76` already warns that this figure "can rise simply because idle lobbies leave its denominator". It follows policy settings, not how well players were served.
- The timeline defaults to a 100% share (`MetricsChart.svelte:24-26`, `metrics.md:25-28`), so changes in lobby count don't show.
Together these leave the page unable to answer the questions in #35, such as how often a map had demand and no supply.
**Screenshots**
The preview's samples were replayed through the autoscaling rules (min 1, max 3, 1 spare, 15-minute empty interval) with capacity recorded as null, as production records it. The fixture also has game-wide T5 and T6 policies, like live.
Before, summary cards:
After (mockup), empty lobby available:

Before, maps table:
After (mockup), no empty lobby column:
Before, Hosting insights:
After (mockup), autoscaling signals:
Before, headline:
After (mockup), lobbies running:
Before, timeline:
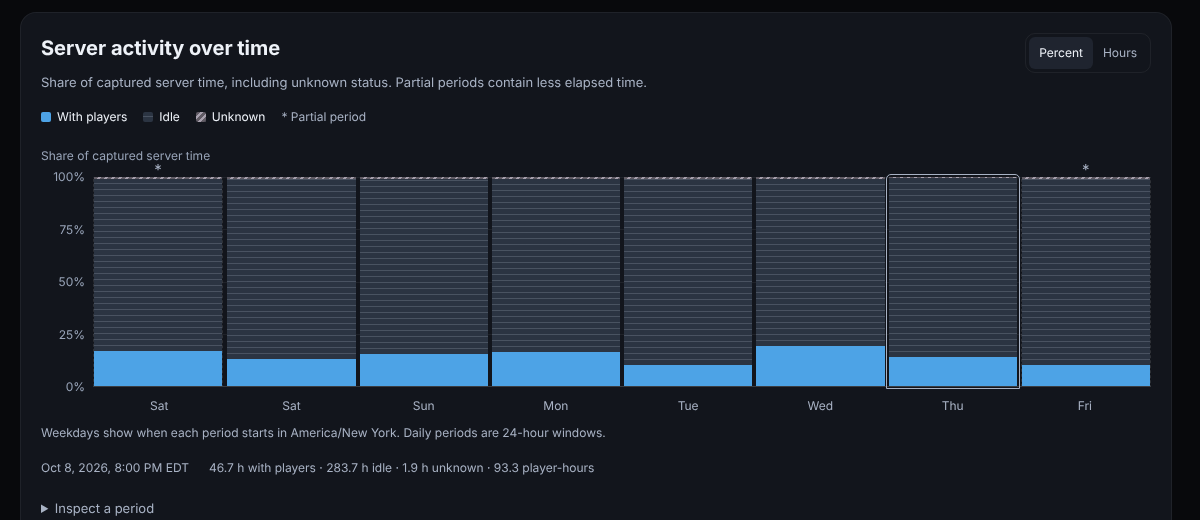
After (mockup), lobbies over time:
**Fix**
- [x] Replace "Time all lobbies were full" (card, maps column and details) with time with no empty lobby per map: collections where no lobby on that game/map reported zero players, worked out from occupancy alone
- [x] Count a map whose lobbies are all unknown as unknown, not as short of a spare
- [x] Stop marking maps "Limited evidence" and suggestions tentative because capacity is missing (`MetricsTables.svelte:228`, `metrics-insights.ts:40-44`), and remove the "lack capacity data" notice (`MetricsSummary.svelte:87-90`)
- [x] Replace Hosting insights with policy-aware signals: no empty lobby at the policy maximum suggests raising the maximum, and below it suggests raising the spare target or checking create time, each linking to the policy
- [x] For maps without a policy, suggest adding one instead of a manual lineup trial
- [x] Replace the "Time with players" card with lobbies running (average and peak) and the share of lobby-hours that were empty spares
- [x] Default the timeline to average lobbies running, split into with players, empty spare and unknown
- [x] Rewrite `metrics.md` (overview, timeline, comparisons and hosting experiments, capacity) and the About text (`+page.svelte:372-389`) to match
- [x] Remove the hard-coded capacity from the fixture's samples (`fixture-data.ts:373`)
Reviewed 33da4482a6. All nine fix items are done, so I'm closing this.
Checklist
No empty lobby replaces all lobbies full. For each collection, fleet/metrics.ts now records whether any lobby on a game/map reported zero players. It adds the map time to noEmpty when at least one lobby is known and none is empty, and it no longer reads capacity. The summary card is now "Time with no empty lobby", and the maps table has a "No empty lobby" column and detail. The new metrics.test.ts cases cover counting without capacity and pooling by known map-hours.
All-unknown maps stay unknown. A collection where every lobby on a map is unknown goes to availabilityUnknown and is left out of the known denominator. Covered by "treats an empty spare as available and all-unknown map observations as unknown".
No capacity-based "Limited evidence". The maps table now checks known availability and the unknown share (MetricsTables.svelte:229-231). The tentative rule in metrics-insights.ts uses availability and lobby coverage, and the "lack capacity data" notice is gone. On the autoscaled preview fixture, no map is marked "Limited evidence".
Policy-aware signals.readMetrics attaches the current policy to each map. metricRecommendations suggests raising the maximum when most no-empty time was at or above it, and reviewing the spare target and create time when it was below. Each signal links to /autoscaling#<policy id>, which matches the section id in PolicyCard.svelte:100. The tab is now "Autoscaling signals".
Maps without a policy. They get "Consider adding an autoscaling policy" with an "Add policy" link instead of a lineup trial.
Lobbies running headline. The first card shows average and peak lobbies and the empty-spare share of captured lobby-hours, from the new running totals.
Average-lobbies timeline.MetricsChart.svelte defaults to average lobbies running per bucket (lobby-hours ÷ captured wall time), split into "With players", "Empty spare" and "Unknown". Share and hours remain as options.
Docs and About text.metrics.md is rewritten (overview, timeline, comparisons, autoscaling signals, definitions, API). The About text matches, and autoscaling.md:76 now points to the new measures.
Fixture capacity.fixture-data.ts:373 now writes NULL, as production does.
Review notes
Good extra work: migration 13 adds triggers so policy edits and the global pause invalidate cached reports. Background refresh also validates the new fields (metrics-refresh.ts).
Live doesn't run this commit yet. I ran the commit's map-label matching against the 19 map labels live records, and all 19 resolve to a catalog slug, so the game-wide T5 and T6 policies will attach to every live map. On the autoscaled preview fixture from the issue screenshots, the page shows 14 lobbies on average (peak 16), 1.1% time with no empty lobby, and Kino Der Toten at 4.1%.
npm run check is clean, and the 8 test files the commit touched pass locally (81 tests).
Minor and non-blocking: a paused or off policy is checked before shortage (metrics-insights.ts:86,99). Under a global pause, every map shows the same "Review and resume the autoscaling policy" finding, and a real shortage moves into the evidence text. On the preview, Kino's 4.1% (4.1 h at the maximum) would otherwise read "Consider raising the policy maximum". A single page-level pause notice, with shortage signals still shown, might read better.
Minor and non-blocking: the heatmap still says "Time with players as a share of known server time" and "Unknown server time" (MetricsHeatmap.svelte:105,236), while the rest of the page now says lobby time. The chart's y-axis ticks can also land on fractions such as 3.75 and 11.3 lobbies.
Reviewed 33da4482a6c6b6dbb20246bc6663e419c272a0c8. All nine fix items are done, so I'm closing this.
**Checklist**
- [x] **No empty lobby replaces all lobbies full.** For each collection, `fleet/metrics.ts` now records whether any lobby on a game/map reported zero players. It adds the map time to `noEmpty` when at least one lobby is known and none is empty, and it no longer reads capacity. The summary card is now "Time with no empty lobby", and the maps table has a "No empty lobby" column and detail. The new `metrics.test.ts` cases cover counting without capacity and pooling by known map-hours.
- [x] **All-unknown maps stay unknown.** A collection where every lobby on a map is unknown goes to `availabilityUnknown` and is left out of the known denominator. Covered by "treats an empty spare as available and all-unknown map observations as unknown".
- [x] **No capacity-based "Limited evidence".** The maps table now checks known availability and the unknown share (`MetricsTables.svelte:229-231`). The tentative rule in `metrics-insights.ts` uses availability and lobby coverage, and the "lack capacity data" notice is gone. On the autoscaled preview fixture, no map is marked "Limited evidence".
- [x] **Policy-aware signals.** `readMetrics` attaches the current policy to each map. `metricRecommendations` suggests raising the maximum when most no-empty time was at or above it, and reviewing the spare target and create time when it was below. Each signal links to `/autoscaling#<policy id>`, which matches the section id in `PolicyCard.svelte:100`. The tab is now "Autoscaling signals".
- [x] **Maps without a policy.** They get "Consider adding an autoscaling policy" with an "Add policy" link instead of a lineup trial.
- [x] **Lobbies running headline.** The first card shows average and peak lobbies and the empty-spare share of captured lobby-hours, from the new `running` totals.
- [x] **Average-lobbies timeline.** `MetricsChart.svelte` defaults to average lobbies running per bucket (lobby-hours ÷ captured wall time), split into "With players", "Empty spare" and "Unknown". Share and hours remain as options.
- [x] **Docs and About text.** `metrics.md` is rewritten (overview, timeline, comparisons, autoscaling signals, definitions, API). The About text matches, and `autoscaling.md:76` now points to the new measures.
- [x] **Fixture capacity.** `fixture-data.ts:373` now writes `NULL`, as production does.
**Review notes**
- Good extra work: migration 13 adds triggers so policy edits and the global pause invalidate cached reports. Background refresh also validates the new fields (`metrics-refresh.ts`).
- Live doesn't run this commit yet. I ran the commit's map-label matching against the 19 map labels live records, and all 19 resolve to a catalog slug, so the game-wide T5 and T6 policies will attach to every live map. On the autoscaled preview fixture from the issue screenshots, the page shows 14 lobbies on average (peak 16), 1.1% time with no empty lobby, and Kino Der Toten at 4.1%.
- `npm run check` is clean, and the 8 test files the commit touched pass locally (81 tests).
- Minor and non-blocking: a paused or off policy is checked before shortage (`metrics-insights.ts:86,99`). Under a global pause, every map shows the same "Review and resume the autoscaling policy" finding, and a real shortage moves into the evidence text. On the preview, Kino's 4.1% (4.1 h at the maximum) would otherwise read "Consider raising the policy maximum". A single page-level pause notice, with shortage signals still shown, might read better.
- Minor and non-blocking: the heatmap still says "Time with players as a share of known server time" and "Unknown server time" (`MetricsHeatmap.svelte:105,236`), while the rest of the page now says lobby time. The chart's y-axis ticks can also land on fractions such as 3.75 and 11.3 lobbies.
Reviewed ea932ec563. It fixes both non-blocking notes from my last review, and all nine fix items are still done, so this stays closed.
Checklist
No empty lobby replaces all lobbies full. Unchanged since 33da448.
All-unknown maps stay unknown. Unchanged.
No capacity-based "Limited evidence". Unchanged.
Policy-aware signals. These now survive a global pause. fleet/metrics.ts:126 passes only the policy's own pausedReason, and the global pause is reported once as autoscalingPaused (fleet/metrics.ts:440). MetricsExplore.svelte:73 shows it as a single notice above the signals. An individually paused or off policy still gets a policy review.
Maps without a policy. Unchanged.
Lobbies running headline. Unchanged.
Average-lobbies timeline. The axis now uses whole-lobby steps from metricLobbyAxis (ui/metrics.ts:42), and period details still show fractional averages.
Docs and About text.metrics.md:81 explains the global pause notice, and the API section lists autoscalingPaused. The About context now says "known lobby time".
Fixture capacity. Unchanged.
Review notes
On the paused, autoscaled preview fixture, the signals show one "Autoscaling is globally paused" notice, then Kino Der Toten with "Consider raising the policy maximum" (4.1% with no empty lobby, 4.1 h of it at the maximum of 3). The other 11 maps read "Keep the policy and watch availability". Before this commit, all 12 read "Review and resume the autoscaling policy".
The heatmap description, cell labels and detail now say lobby time. No "server time" remains in the metrics components, the page or metrics.md.
On the same preview, the chart's y-axis now reads 0, 5, 10, 15 instead of 3.75 and 11.3.
npm run check is clean, and the 8 metrics test files pass locally (93 tests).
Reviewed ea932ec563ef4b95c4ea4e703bf0a6c2bc4f317a. It fixes both non-blocking notes from my last review, and all nine fix items are still done, so this stays closed.
**Checklist**
- [x] **No empty lobby replaces all lobbies full.** Unchanged since 33da448.
- [x] **All-unknown maps stay unknown.** Unchanged.
- [x] **No capacity-based "Limited evidence".** Unchanged.
- [x] **Policy-aware signals.** These now survive a global pause. `fleet/metrics.ts:126` passes only the policy's own `pausedReason`, and the global pause is reported once as `autoscalingPaused` (`fleet/metrics.ts:440`). `MetricsExplore.svelte:73` shows it as a single notice above the signals. An individually paused or off policy still gets a policy review.
- [x] **Maps without a policy.** Unchanged.
- [x] **Lobbies running headline.** Unchanged.
- [x] **Average-lobbies timeline.** The axis now uses whole-lobby steps from `metricLobbyAxis` (`ui/metrics.ts:42`), and period details still show fractional averages.
- [x] **Docs and About text.** `metrics.md:81` explains the global pause notice, and the API section lists `autoscalingPaused`. The About context now says "known lobby time".
- [x] **Fixture capacity.** Unchanged.
**Review notes**
- On the paused, autoscaled preview fixture, the signals show one "Autoscaling is globally paused" notice, then Kino Der Toten with "Consider raising the policy maximum" (4.1% with no empty lobby, 4.1 h of it at the maximum of 3). The other 11 maps read "Keep the policy and watch availability". Before this commit, all 12 read "Review and resume the autoscaling policy".
- The heatmap description, cell labels and detail now say lobby time. No "server time" remains in the metrics components, the page or `metrics.md`.
- On the same preview, the chart's y-axis now reads 0, 5, 10, 15 instead of 3.75 and 11.3.
- `npm run check` is clean, and the 8 metrics test files pass locally (93 tests).
Blocking a user prevents them from interacting with repositories, such as opening or commenting on pull requests or issues. Learn more about blocking a user.


Metrics predates autoscaling. Its headline, its capacity measure and its hosting advice all assume a fixed lineup that operators change by hand. On the current fleet, with T5 and T6 policies covering every map (1–3 lobbies, 1 empty spare), they show no data, read as failure, or give advice that can't be followed.
All lobbies full never has data and tests the wrong thing:
worker.ts:374takes capacity only fromsv_maxclientsin an RCON reply (rcon.ts:423,558-563). Live replies don't include it:t5_zombie_theater_1had 2 players and a clean RCON reply with pings, and itscapacitywas null.worker.ts:335skips RCON when the telemetry roster is empty, andfleet/metrics.ts:271-285only counts a map when every lobby on it has a capacity. Autoscaling always keeps an empty spare, so this would fail even if the parsing worked.MetricsSummary.svelte:69-82) always shows "—", and every map row says "Limited evidence" (MetricsTables.svelte:228).autoscaling.md:3says a partly occupied Zombies lobby isn't a spare, so "players ≥ max clients" doesn't measure whether a new group can find a lobby.fixture-data.ts:373writes capacity 4 on every sample, so the preview hides all of this.Hosting insights give advice that autoscaling makes impossible or redundant:
metricRecommendations(metrics-insights.ts:25) only sees map totals, never policies. On live, 18 of 19 maps get "Trial less idle hosting… Review one idle lobby" (metrics-insights.ts:80-91) and the other gets "Check capacity during busy hours".autoscaling.md:36says manual Destroy is rejected while a policy is live. "Trial one additional lobby" (metrics-insights.ts:61-69) is what autoscaling already does.MetricsExplore.svelte:67-68) and the advice sits under "Other findings".metrics.md:44-79still describes "Explore this period", "Map capacity pressure" and "Hosting experiments", none of which exist on the page."Time with players" penalises the spares autoscaling keeps on purpose:
MetricsSummary.svelte:33-49) is occupied ÷ known server time. On live it reads 3.8% (89.1 h of 2,317 h over 7 days), because 2,228 h of 2,553 lobby-hours (87%) were spares waiting for a group.autoscaling.md:76already warns that this figure "can rise simply because idle lobbies leave its denominator". It follows policy settings, not how well players were served.MetricsChart.svelte:24-26,metrics.md:25-28), so changes in lobby count don't show.Together these leave the page unable to answer the questions in #35, such as how often a map had demand and no supply.
Screenshots
The preview's samples were replayed through the autoscaling rules (min 1, max 3, 1 spare, 15-minute empty interval) with capacity recorded as null, as production records it. The fixture also has game-wide T5 and T6 policies, like live.
Before, summary cards:

After (mockup), empty lobby available:

Before, maps table:

After (mockup), no empty lobby column:

Before, Hosting insights:

After (mockup), autoscaling signals:

Before, headline:

After (mockup), lobbies running:

Before, timeline:

After (mockup), lobbies over time:

Fix
MetricsTables.svelte:228,metrics-insights.ts:40-44), and remove the "lack capacity data" notice (MetricsSummary.svelte:87-90)metrics.md(overview, timeline, comparisons and hosting experiments, capacity) and the About text (+page.svelte:372-389) to matchfixture-data.ts:373)Reviewed
33da4482a6. All nine fix items are done, so I'm closing this.Checklist
fleet/metrics.tsnow records whether any lobby on a game/map reported zero players. It adds the map time tonoEmptywhen at least one lobby is known and none is empty, and it no longer reads capacity. The summary card is now "Time with no empty lobby", and the maps table has a "No empty lobby" column and detail. The newmetrics.test.tscases cover counting without capacity and pooling by known map-hours.availabilityUnknownand is left out of the known denominator. Covered by "treats an empty spare as available and all-unknown map observations as unknown".MetricsTables.svelte:229-231). The tentative rule inmetrics-insights.tsuses availability and lobby coverage, and the "lack capacity data" notice is gone. On the autoscaled preview fixture, no map is marked "Limited evidence".readMetricsattaches the current policy to each map.metricRecommendationssuggests raising the maximum when most no-empty time was at or above it, and reviewing the spare target and create time when it was below. Each signal links to/autoscaling#<policy id>, which matches the section id inPolicyCard.svelte:100. The tab is now "Autoscaling signals".runningtotals.MetricsChart.sveltedefaults to average lobbies running per bucket (lobby-hours ÷ captured wall time), split into "With players", "Empty spare" and "Unknown". Share and hours remain as options.metrics.mdis rewritten (overview, timeline, comparisons, autoscaling signals, definitions, API). The About text matches, andautoscaling.md:76now points to the new measures.fixture-data.ts:373now writesNULL, as production does.Review notes
metrics-refresh.ts).npm run checkis clean, and the 8 test files the commit touched pass locally (81 tests).metrics-insights.ts:86,99). Under a global pause, every map shows the same "Review and resume the autoscaling policy" finding, and a real shortage moves into the evidence text. On the preview, Kino's 4.1% (4.1 h at the maximum) would otherwise read "Consider raising the policy maximum". A single page-level pause notice, with shortage signals still shown, might read better.MetricsHeatmap.svelte:105,236), while the rest of the page now says lobby time. The chart's y-axis ticks can also land on fractions such as 3.75 and 11.3 lobbies.Reviewed
ea932ec563. It fixes both non-blocking notes from my last review, and all nine fix items are still done, so this stays closed.Checklist
33da448.fleet/metrics.ts:126passes only the policy's ownpausedReason, and the global pause is reported once asautoscalingPaused(fleet/metrics.ts:440).MetricsExplore.svelte:73shows it as a single notice above the signals. An individually paused or off policy still gets a policy review.metricLobbyAxis(ui/metrics.ts:42), and period details still show fractional averages.metrics.md:81explains the global pause notice, and the API section listsautoscalingPaused. The About context now says "known lobby time".Review notes
metrics.md.npm run checkis clean, and the 8 metrics test files pass locally (93 tests).