The autoscaling guide says Metrics shows observed capacity and provisioning measurements, but Metrics has no autoscaling or provisioning data. These numbers only appear on the policy card, as fixed 31-day totals.
autoscaling.md:13 says to use Metrics "for observed capacity and provisioning measurements".
MetricsData (metrics.ts:101-120) and readMetrics (fleet/metrics.ts:57) contain nothing from autoscaling_samples, autoscaling_decisions or Provisioning.
PolicyCard.svelte:362-390 shows empty lobby-hours, deficit minutes, creates, removals and request-to-ready time for the last 31 days only, with no range, map split or trend. Live T5 shows 73 creates, 48 removals, 1 failure, and request-to-ready of 72 s on average (168 s maximum).
The pilot steps (autoscaling.md:71) ask operators to monitor request-to-ready time, spare deficits and removals, but there's nowhere to see them for a chosen period.
Screenshots
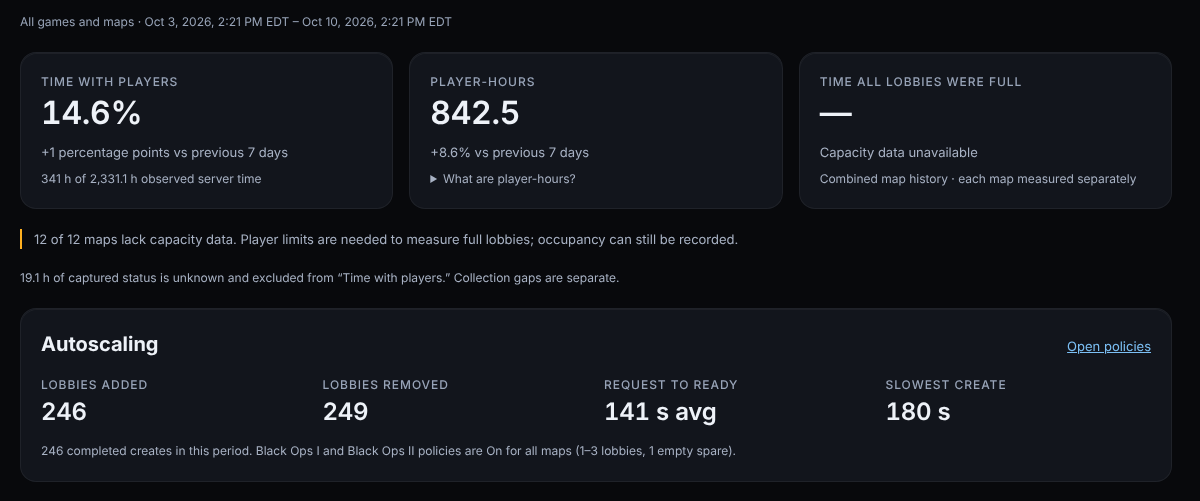
Same preview data as #137. The mockup counts lobbies appearing and disappearing in the samples; the real section would read Provisioning records.
Before:
After (mockup), Autoscaling section:
Fix
Add an Autoscaling section to Metrics for the selected range and scope: lobbies added and removed, failed or cancelled operations, and request-to-ready average and maximum from autoscaling Provisioning records
Link the section to the policies
Update autoscaling.md:13 to describe what Metrics shows
The autoscaling guide says Metrics shows observed capacity and provisioning measurements, but Metrics has no autoscaling or provisioning data. These numbers only appear on the policy card, as fixed 31-day totals.
- `autoscaling.md:13` says to use **Metrics** "for observed capacity and provisioning measurements".
- `MetricsData` (`metrics.ts:101-120`) and `readMetrics` (`fleet/metrics.ts:57`) contain nothing from `autoscaling_samples`, `autoscaling_decisions` or Provisioning.
- `PolicyCard.svelte:362-390` shows empty lobby-hours, deficit minutes, creates, removals and request-to-ready time for the last 31 days only, with no range, map split or trend. Live T5 shows 73 creates, 48 removals, 1 failure, and request-to-ready of 72 s on average (168 s maximum).
The pilot steps (`autoscaling.md:71`) ask operators to monitor request-to-ready time, spare deficits and removals, but there's nowhere to see them for a chosen period.
**Screenshots**
Same preview data as #137. The mockup counts lobbies appearing and disappearing in the samples; the real section would read Provisioning records.
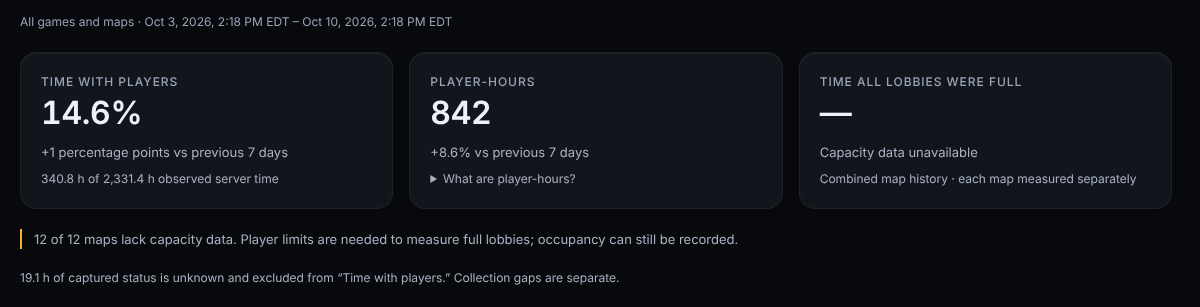
Before:
After (mockup), Autoscaling section:
**Fix**
- [x] Add an Autoscaling section to Metrics for the selected range and scope: lobbies added and removed, failed or cancelled operations, and request-to-ready average and maximum from autoscaling Provisioning records
- [x] Link the section to the policies
- [x] Update `autoscaling.md:13` to describe what Metrics shows
Reviewed 528ed7f37a. All three fix items are done, so I'm closing this.
Checklist
Autoscaling section on Metrics.metrics-autoscaling.ts:6-89 reads autoscaling-linked Provisioning records whose finished_at is in the selected window, and MetricsAutoscaling.svelte shows lobbies added and removed, failed and cancelled operations, and request-to-ready average and maximum for the selected range, game and map. Request-to-ready uses the same started_at to finished_at span as the policy card (autoscaling/index.ts:529-530). Both timestamps are written with toISOString() (history.ts:54,534), so the window's string comparisons hold. Scope comes from the operation's recorded server name, so T6 variants stay separate (metrics-autoscaling.test.ts:118).
Link to the policies. The section header links to /autoscaling ("Open policies", MetricsAutoscaling.svelte:16).
Update autoscaling.md:13. It now lists what Metrics shows and links to metrics.md, which has a new "Autoscaling operations" section and API notes. The pilot step at autoscaling.md:71 now points to Metrics too.
Review notes
Good extra catch: migration 15 (revisions.ts:4) invalidates the cached report when an autoscaling operation finishes or its source link changes, so outcomes show up even when no new occupancy samples arrive (report-workers.test.ts:162).
The 6 affected test files pass locally (100 tests): metrics-autoscaling, database-migrations, metrics-refresh, report-workers, ui-metrics-page and metrics. Run 856 passed on 7fcf1cd, which includes this commit.
Minor and non-blocking: the policy card's 31-day "creates" counts every autoscaling create started in the period, failed ones included (autoscaling/index.ts:526), while Metrics' "Lobbies added" counts successful creates by finish time. The two can differ for the same days. autoscaling.md:13 says the card keeps separate totals, but not that they're counted differently.
Minor and non-blocking: the synthetic preview's only autoscaling-linked operation is a rebuild (fixture-data.ts:443-448,563-568), which autoscaling never submits (it queues only creates and destroys, autoscaling/index.ts:403-418). The preview therefore always shows an empty Autoscaling section.
I couldn't compare against live: its /api/metrics has no autoscaling field yet, so these commits aren't deployed.
Reviewed 528ed7f37aafdd7bd13b5bb6653dadfb8f971d2d. All three fix items are done, so I'm closing this.
**Checklist**
- [x] **Autoscaling section on Metrics.** `metrics-autoscaling.ts:6-89` reads autoscaling-linked Provisioning records whose `finished_at` is in the selected window, and `MetricsAutoscaling.svelte` shows lobbies added and removed, failed and cancelled operations, and request-to-ready average and maximum for the selected range, game and map. Request-to-ready uses the same `started_at` to `finished_at` span as the policy card (`autoscaling/index.ts:529-530`). Both timestamps are written with `toISOString()` (`history.ts:54,534`), so the window's string comparisons hold. Scope comes from the operation's recorded server name, so T6 variants stay separate (`metrics-autoscaling.test.ts:118`).
- [x] **Link to the policies.** The section header links to `/autoscaling` ("Open policies", `MetricsAutoscaling.svelte:16`).
- [x] **Update `autoscaling.md:13`.** It now lists what Metrics shows and links to `metrics.md`, which has a new "Autoscaling operations" section and API notes. The pilot step at `autoscaling.md:71` now points to Metrics too.
**Review notes**
- Good extra catch: migration 15 (`revisions.ts:4`) invalidates the cached report when an autoscaling operation finishes or its source link changes, so outcomes show up even when no new occupancy samples arrive (`report-workers.test.ts:162`).
- The 6 affected test files pass locally (100 tests): `metrics-autoscaling`, `database-migrations`, `metrics-refresh`, `report-workers`, `ui-metrics-page` and `metrics`. [Run 856](https://gitea.thewrightserver.net/josh/electric-cherry/actions/runs/856) passed on 7fcf1cd, which includes this commit.
- Minor and non-blocking: the policy card's 31-day "creates" counts every autoscaling create started in the period, failed ones included (`autoscaling/index.ts:526`), while Metrics' "Lobbies added" counts successful creates by finish time. The two can differ for the same days. `autoscaling.md:13` says the card keeps separate totals, but not that they're counted differently.
- Minor and non-blocking: the synthetic preview's only autoscaling-linked operation is a `rebuild` (`fixture-data.ts:443-448,563-568`), which autoscaling never submits (it queues only creates and destroys, `autoscaling/index.ts:403-418`). The preview therefore always shows an empty Autoscaling section.
- I couldn't compare against live: its `/api/metrics` has no `autoscaling` field yet, so these commits aren't deployed.
Blocking a user prevents them from interacting with repositories, such as opening or commenting on pull requests or issues. Learn more about blocking a user.


The autoscaling guide says Metrics shows observed capacity and provisioning measurements, but Metrics has no autoscaling or provisioning data. These numbers only appear on the policy card, as fixed 31-day totals.
autoscaling.md:13says to use Metrics "for observed capacity and provisioning measurements".MetricsData(metrics.ts:101-120) andreadMetrics(fleet/metrics.ts:57) contain nothing fromautoscaling_samples,autoscaling_decisionsor Provisioning.PolicyCard.svelte:362-390shows empty lobby-hours, deficit minutes, creates, removals and request-to-ready time for the last 31 days only, with no range, map split or trend. Live T5 shows 73 creates, 48 removals, 1 failure, and request-to-ready of 72 s on average (168 s maximum).The pilot steps (
autoscaling.md:71) ask operators to monitor request-to-ready time, spare deficits and removals, but there's nowhere to see them for a chosen period.Screenshots
Same preview data as #137. The mockup counts lobbies appearing and disappearing in the samples; the real section would read Provisioning records.
Before:

After (mockup), Autoscaling section:

Fix
autoscaling.md:13to describe what Metrics showsReviewed
528ed7f37a. All three fix items are done, so I'm closing this.Checklist
metrics-autoscaling.ts:6-89reads autoscaling-linked Provisioning records whosefinished_atis in the selected window, andMetricsAutoscaling.svelteshows lobbies added and removed, failed and cancelled operations, and request-to-ready average and maximum for the selected range, game and map. Request-to-ready uses the samestarted_attofinished_atspan as the policy card (autoscaling/index.ts:529-530). Both timestamps are written withtoISOString()(history.ts:54,534), so the window's string comparisons hold. Scope comes from the operation's recorded server name, so T6 variants stay separate (metrics-autoscaling.test.ts:118)./autoscaling("Open policies",MetricsAutoscaling.svelte:16).autoscaling.md:13. It now lists what Metrics shows and links tometrics.md, which has a new "Autoscaling operations" section and API notes. The pilot step atautoscaling.md:71now points to Metrics too.Review notes
revisions.ts:4) invalidates the cached report when an autoscaling operation finishes or its source link changes, so outcomes show up even when no new occupancy samples arrive (report-workers.test.ts:162).metrics-autoscaling,database-migrations,metrics-refresh,report-workers,ui-metrics-pageandmetrics. Run 856 passed on7fcf1cd, which includes this commit.autoscaling/index.ts:526), while Metrics' "Lobbies added" counts successful creates by finish time. The two can differ for the same days.autoscaling.md:13says the card keeps separate totals, but not that they're counted differently.rebuild(fixture-data.ts:443-448,563-568), which autoscaling never submits (it queues only creates and destroys,autoscaling/index.ts:403-418). The preview therefore always shows an empty Autoscaling section./api/metricshas noautoscalingfield yet, so these commits aren't deployed.