Metrics shows lobbies, player-hours and matches, but not how many different people played or how many were new. The leaderboard already records both, so a players line chart for the selected range (24 hours, 7 days or 30 days) can be built from data we already keep.
MetricsChart.svelte:132 "Lobbies running over time" is the page's only trend chart. Players appear only as player-hours in its selected-period summary (MetricsChart.svelte:237).
metrics.ts:280-292 reads leaderboard_match_players only to count participants per match for group size. Nothing counts distinct players across matches or periods.
schema.sql:61-80 stores first_seen_at and last_seen_at for each player in each match. That's enough to place a player in every hour or day they played.
leaderboard-ingest.ts:140-144 sets leaderboard_players.first_seen_at on a player's first event and never changes it. retention.ts:144-152 expires matches (their players cascade) but not leaderboard_players, so an expired match can't make a returning player look new.
player-profile.ts:30 already treats one GUID across T5 and T6 as one player (MIN(first_seen_at) across games). New-player counts should use the same identity.
#20's closing comment suggested "an additional graph to show on the metrics page. Perhaps for global player count". Unique and new players are the two numbers that show whether the player base is growing, and whether a busy day was regulars or newcomers.
Two limits should show on the chart instead of being plotted as zeros or added up:
Player history only goes back to when leaderboard recording started (leaderboard-ingest.ts:212, "older games are gone"). Live's earliest match is from 18 September (GET /api/matches), so today's 30-day range starts 8 days before any player history, and on the first recorded days every player counts as new.
Per-period unique counts don't add up to the range's total. A player who plays every day counts 7 times across the 7-day chart, so range totals need their own count.
Screenshots
Same synthetic fixture for all shots. The fixture reuses one pool of 80 players, so I reassigned match participants in the disposable fixture database so returning and first-time players mix (142 players, 5 to 17 new per day), and rebuilt leaderboard_players from those participations the way ingest records it. Lobby samples are simulated as in #137.
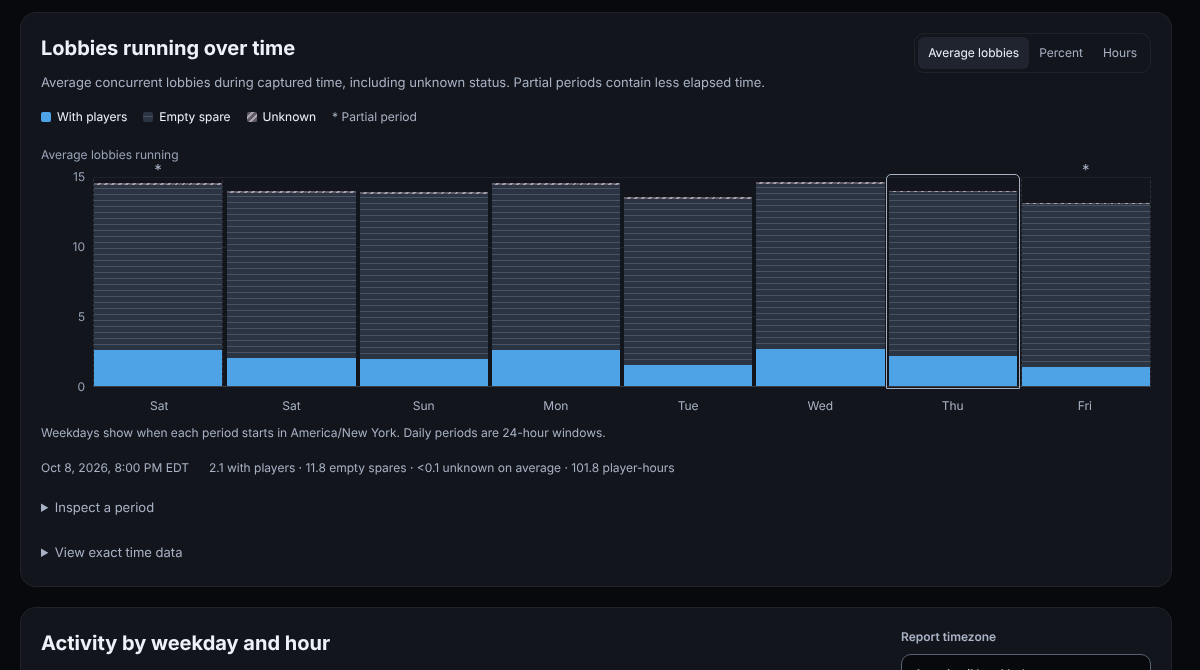
Before (7 days):
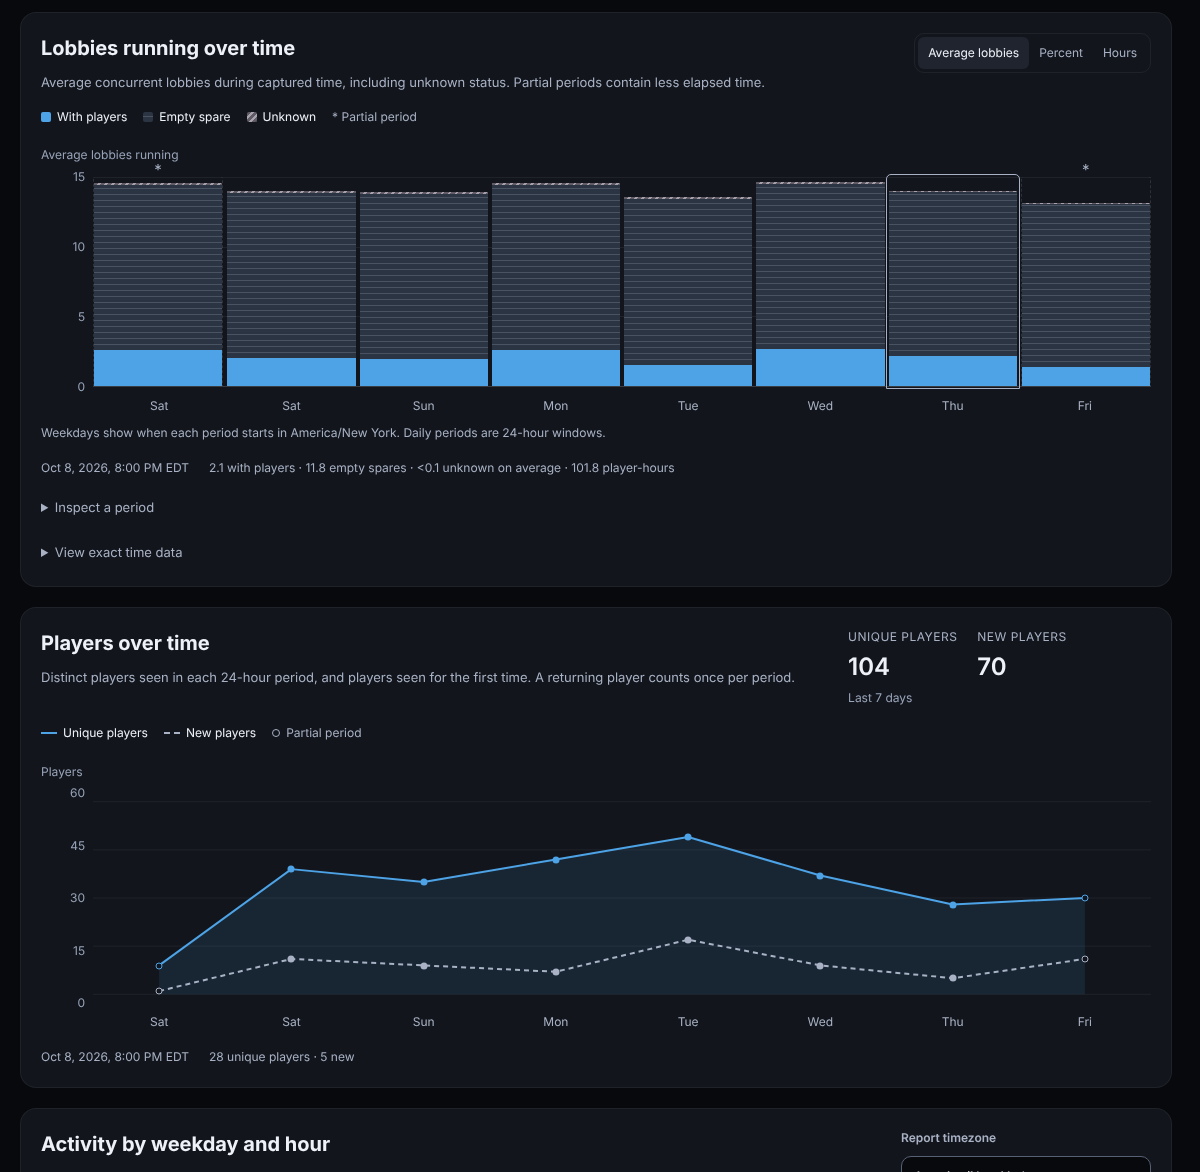
After (mockup), 7 days:
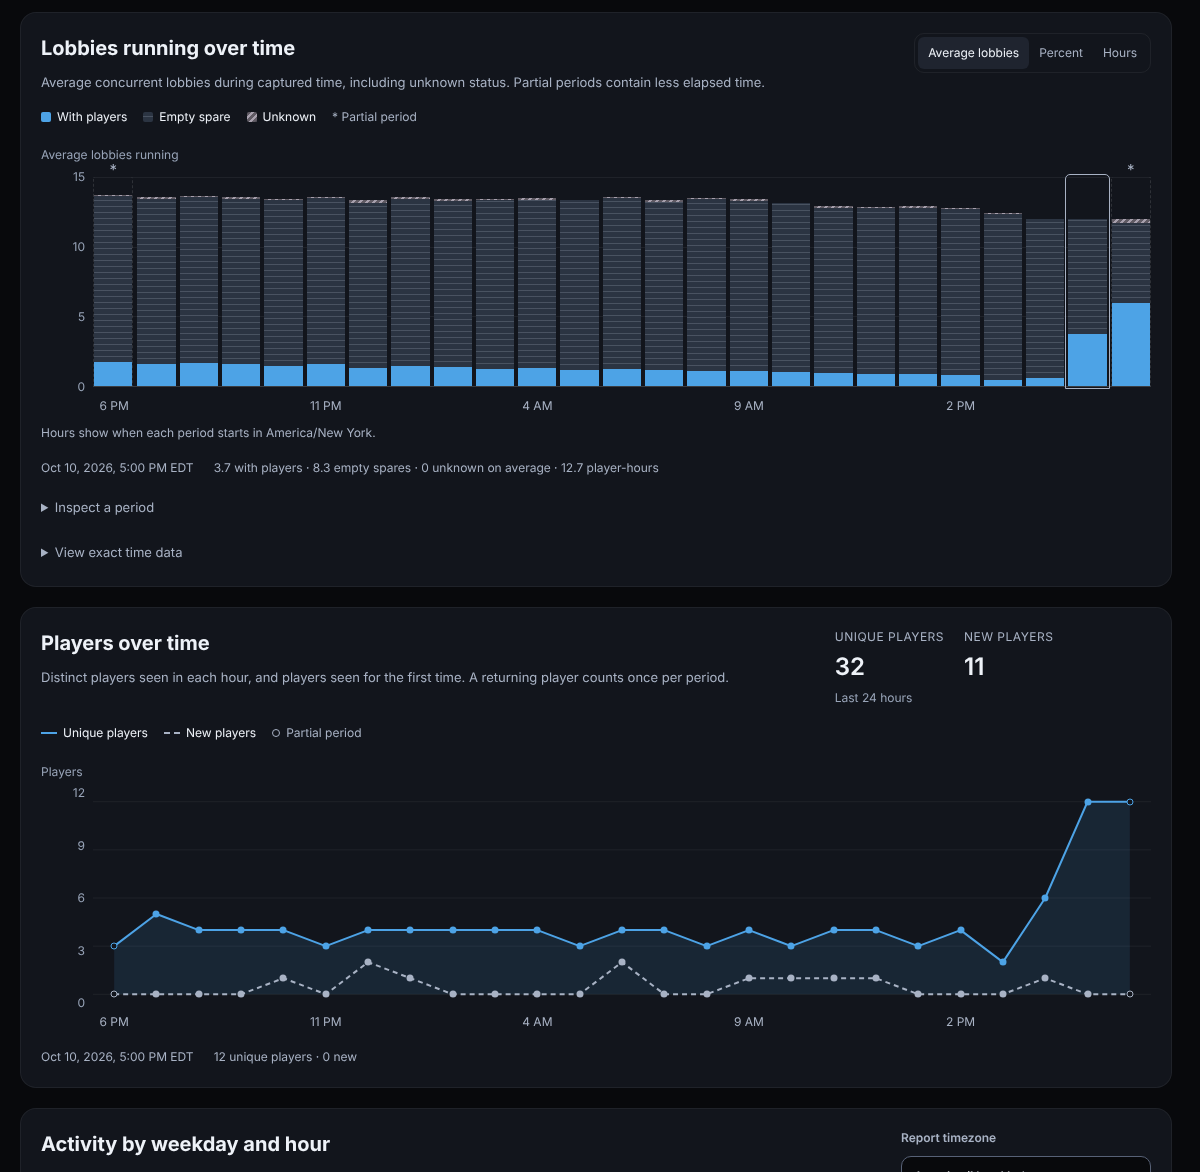
After (mockup), 24 hours:
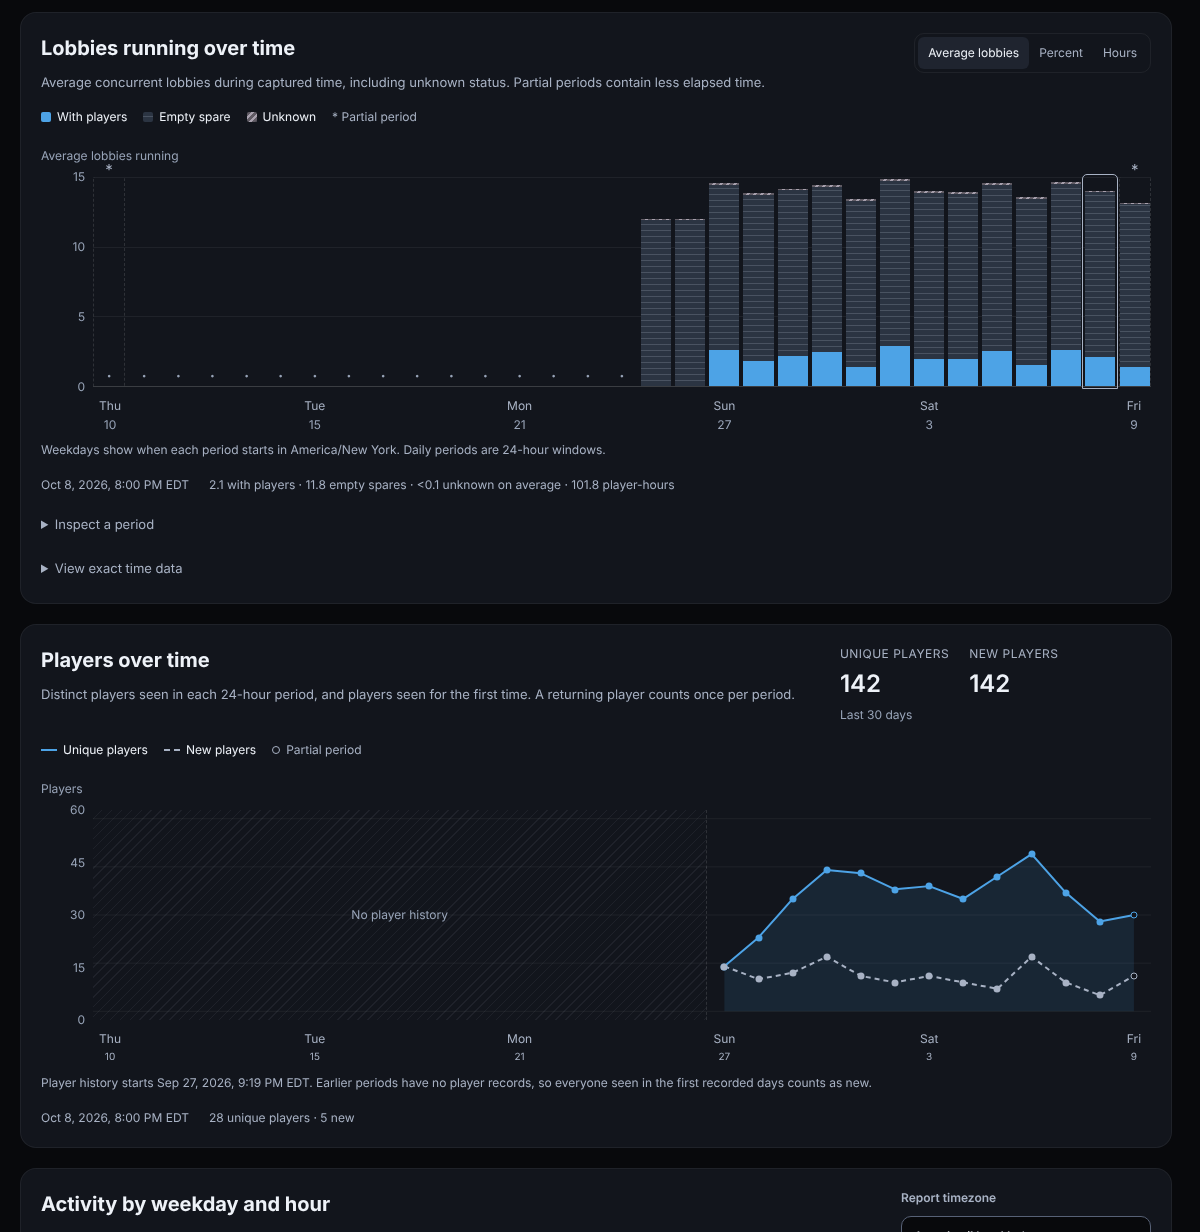
After (mockup), 30 days. The fixture's player history starts on 28 September, so earlier periods are a gap with a note rather than zero players:
After (mockup), phone (390×844):
Fix
Add uniquePlayers and newPlayers to each metrics period, using the lobby chart's periods (hourly for 24 hours, 24-hour periods for 7 and 30 days, metrics.ts:108).
Count a player as unique in every period their match participation (first_seen_at to last_seen_at) overlaps, once per period however many matches they played.
Count a player as new in the period that holds their earliest leaderboard_players.first_seen_at across games.
Apply the Game and Map filters: unique counts only scoped matches, and new counts players whose first recorded match is in scope.
Add range totals for unique and new players, counted as distinct GUIDs across the whole range rather than summed from periods.
Add a "Players over time" line chart below "Lobbies running over time" with both lines, the range totals and partial-period markers.
Show periods before player history (or before the earliest retained match, when match retention is shorter than the range) as gaps with a note, not as zero players.
Give the chart the same keyboard and screen-reader access as the lobby chart: a period readout and a "View exact time data" table (MetricsChart.svelte:319).
Document both series and their limits in docs/guides/metrics.md.
Add tests: a player spanning two periods counts in both, two matches in one period count once, the same GUID in T5 and T6 is new once, the filters apply, and periods before player history are gaps.
Metrics shows lobbies, player-hours and matches, but not how many different people played or how many were new. The leaderboard already records both, so a players line chart for the selected range (24 hours, 7 days or 30 days) can be built from data we already keep.
- `MetricsChart.svelte:132` "Lobbies running over time" is the page's only trend chart. Players appear only as player-hours in its selected-period summary (`MetricsChart.svelte:237`).
- `metrics.ts:280-292` reads `leaderboard_match_players` only to count participants per match for group size. Nothing counts distinct players across matches or periods.
- `schema.sql:61-80` stores `first_seen_at` and `last_seen_at` for each player in each match. That's enough to place a player in every hour or day they played.
- `leaderboard-ingest.ts:140-144` sets `leaderboard_players.first_seen_at` on a player's first event and never changes it. `retention.ts:144-152` expires matches (their players cascade) but not `leaderboard_players`, so an expired match can't make a returning player look new.
- `player-profile.ts:30` already treats one GUID across T5 and T6 as one player (`MIN(first_seen_at)` across games). New-player counts should use the same identity.
#20's closing comment suggested "an additional graph to show on the metrics page. Perhaps for global player count". Unique and new players are the two numbers that show whether the player base is growing, and whether a busy day was regulars or newcomers.
Two limits should show on the chart instead of being plotted as zeros or added up:
- Player history only goes back to when leaderboard recording started (`leaderboard-ingest.ts:212`, "older games are gone"). Live's earliest match is from 18 September (`GET /api/matches`), so today's 30-day range starts 8 days before any player history, and on the first recorded days every player counts as new.
- Per-period unique counts don't add up to the range's total. A player who plays every day counts 7 times across the 7-day chart, so range totals need their own count.
**Screenshots**
Same synthetic fixture for all shots. The fixture reuses one pool of 80 players, so I reassigned match participants in the disposable fixture database so returning and first-time players mix (142 players, 5 to 17 new per day), and rebuilt `leaderboard_players` from those participations the way ingest records it. Lobby samples are simulated as in #137.
Before (7 days):
After (mockup), 7 days:
After (mockup), 24 hours:
After (mockup), 30 days. The fixture's player history starts on 28 September, so earlier periods are a gap with a note rather than zero players:
After (mockup), phone (390×844):
**Fix**
- [x] Add `uniquePlayers` and `newPlayers` to each metrics period, using the lobby chart's periods (hourly for 24 hours, 24-hour periods for 7 and 30 days, `metrics.ts:108`).
- [x] Count a player as unique in every period their match participation (`first_seen_at` to `last_seen_at`) overlaps, once per period however many matches they played.
- [x] Count a player as new in the period that holds their earliest `leaderboard_players.first_seen_at` across games.
- [x] Apply the Game and Map filters: unique counts only scoped matches, and new counts players whose first recorded match is in scope.
- [x] Add range totals for unique and new players, counted as distinct GUIDs across the whole range rather than summed from periods.
- [x] Add a "Players over time" line chart below "Lobbies running over time" with both lines, the range totals and partial-period markers.
- [x] Show periods before player history (or before the earliest retained match, when match retention is shorter than the range) as gaps with a note, not as zero players.
- [x] Give the chart the same keyboard and screen-reader access as the lobby chart: a period readout and a "View exact time data" table (`MetricsChart.svelte:319`).
- [x] Document both series and their limits in `docs/guides/metrics.md`.
- [x] Add tests: a player spanning two periods counts in both, two matches in one period count once, the same GUID in T5 and T6 is new once, the filters apply, and periods before player history are gaps.
Reviewed e3e740cea3. All ten fix items are done, so I'm closing this.
Checklist
Per-period counts.readPlayerMetrics (metrics-players.ts:5-87) fills uniquePlayers and newPlayers on the lobby chart's own points, so 24 hours uses hourly periods and 7 and 30 days use 24-hour periods.
Unique players by participation. Each leaderboard_match_players row adds its GUID to every period its first_seen_at to last_seen_at span overlaps, using a set per period (metrics-players.ts:62-79). The it.each test checks a span across a boundary and two matches in one period for all three ranges.
New players from the durable first sighting. A row is new only when its start equals the GUID's earliest leaderboard_players.first_seen_at across games (metrics-players.ts:50,68-69). Ingest writes both columns from the same receivedAt (leaderboard-ingest.ts:166-188) and is their only writer, and the backfill replays through it (leaderboard-ingest.ts:234), so the comparison holds for real data. The retention test confirms that deleting a player's old match doesn't make them new again.
Game and Map filters. Unique counts only scoped matches, and new requires the original sighting to be in scope (metrics-players.ts:36-43). The cross-game test covers each game, each map, T6 variants and a missing map.
Range totals.players.uniquePlayers and players.newPlayers are separate sets across the whole range (metrics-players.ts:60-61,86). The test confirms the period values add up to more than the total.
Players over time chart.MetricsPlayers.svelte sits right after the lobby chart (+page.svelte:308) and renders even without occupancy samples. It has both lines, the range totals (MetricsPlayers.svelte:119) and hollow markers for partial periods.
Gaps before player history. Periods ending before the earliest retained match are null (metrics-players.ts:14-26), the lines break there (metrics.ts:4 in $ui), and a note gives the start date (MetricsPlayers.svelte:142-150). Using the earliest retained match also covers match retention shorter than the range.
Keyboard and screen-reader access. Period buttons take Left/Right/Home/End (MetricsPlayers.svelte:187), a live region announces the selection (:259), and there are "Inspect a period" (:223) and "View exact time data" (:261) controls. I drove it in the preview: the arrow keys and Home moved focus and updated the announcement, and the 30-day table showed 31 rows, with dashes before history and "History begins" on the first recorded day.
Docs.metrics.md:86 adds a "Players over time" section covering both series, the filters, the gaps, retention and the API fields.
Tests.metrics-players.test.ts covers each listed case, plus the boundary rules and the no-history state. The migration, refresh, report-worker and page tests cover the rest.
Review notes
Good extra catches:
Migration 16 (revisions.ts:4-22) adds an index on leaderboard_players(guid, first_seen_at) for the per-row lookup.
It also refreshes the cached report when a participation's timestamps change, since per-period counts now depend on last_seen_at.
The method note says that players already playing when recording began count as new.
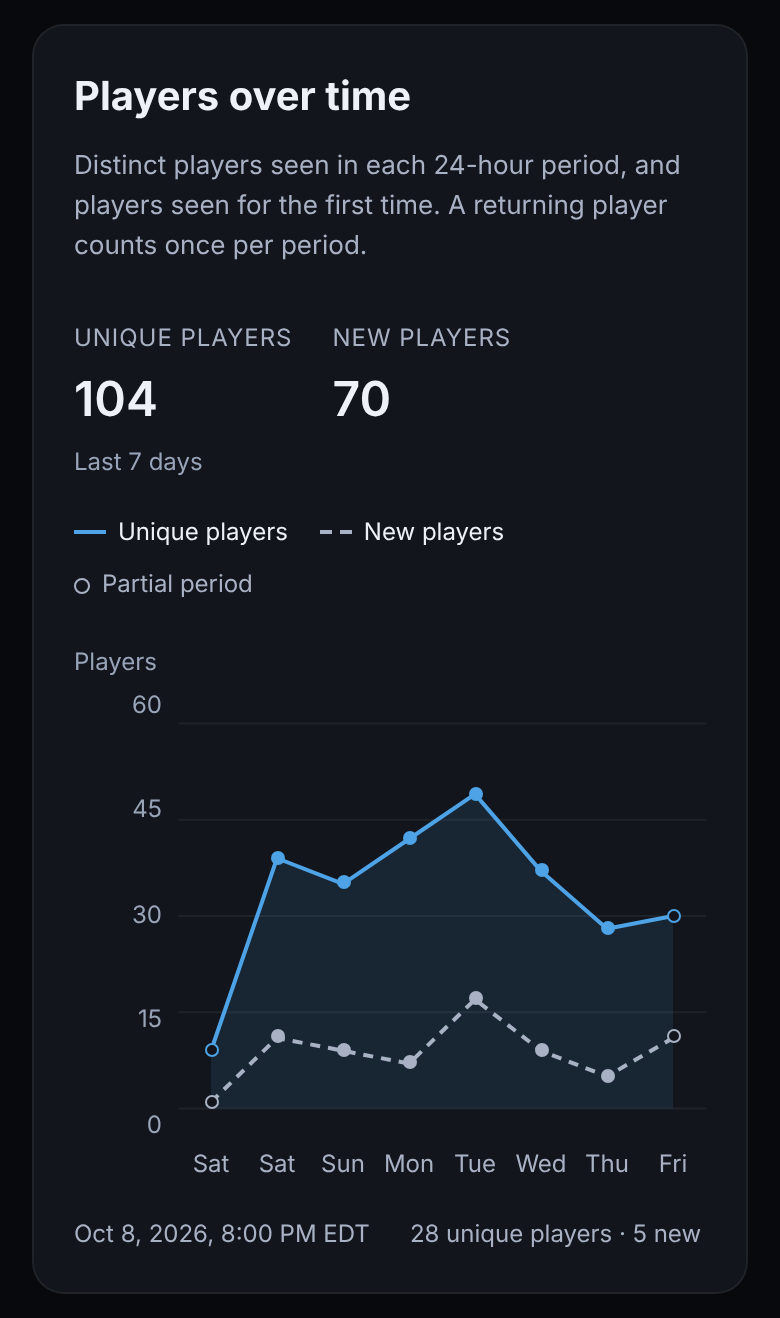
In the same staged preview used for this issue's screenshots, the real chart gives the same totals as the mockup and a direct SQL count: 104 unique and 70 new over 7 days, and 32 and 11 over 24 hours. The 30-day view leaves the periods before the fixture's 27 September history start empty.
The 8 affected test files pass locally (129 tests), and npm run check is clean. Run 857 passed on this commit (218 files, 2,880 tests). As in run 856, migration-memory.test.ts started after every other file finished.
Reviewed e3e740cea3e1149f9bb73630a52e1865d05275b5. All ten fix items are done, so I'm closing this.
**Checklist**
- [x] **Per-period counts.** `readPlayerMetrics` (`metrics-players.ts:5-87`) fills `uniquePlayers` and `newPlayers` on the lobby chart's own `points`, so 24 hours uses hourly periods and 7 and 30 days use 24-hour periods.
- [x] **Unique players by participation.** Each `leaderboard_match_players` row adds its GUID to every period its `first_seen_at` to `last_seen_at` span overlaps, using a set per period (`metrics-players.ts:62-79`). The `it.each` test checks a span across a boundary and two matches in one period for all three ranges.
- [x] **New players from the durable first sighting.** A row is new only when its start equals the GUID's earliest `leaderboard_players.first_seen_at` across games (`metrics-players.ts:50,68-69`). Ingest writes both columns from the same `receivedAt` (`leaderboard-ingest.ts:166-188`) and is their only writer, and the backfill replays through it (`leaderboard-ingest.ts:234`), so the comparison holds for real data. The retention test confirms that deleting a player's old match doesn't make them new again.
- [x] **Game and Map filters.** Unique counts only scoped matches, and new requires the original sighting to be in scope (`metrics-players.ts:36-43`). The cross-game test covers each game, each map, T6 variants and a missing map.
- [x] **Range totals.** `players.uniquePlayers` and `players.newPlayers` are separate sets across the whole range (`metrics-players.ts:60-61,86`). The test confirms the period values add up to more than the total.
- [x] **Players over time chart.** `MetricsPlayers.svelte` sits right after the lobby chart (`+page.svelte:308`) and renders even without occupancy samples. It has both lines, the range totals (`MetricsPlayers.svelte:119`) and hollow markers for partial periods.
- [x] **Gaps before player history.** Periods ending before the earliest retained match are `null` (`metrics-players.ts:14-26`), the lines break there (`metrics.ts:4` in `$ui`), and a note gives the start date (`MetricsPlayers.svelte:142-150`). Using the earliest retained match also covers match retention shorter than the range.
- [x] **Keyboard and screen-reader access.** Period buttons take Left/Right/Home/End (`MetricsPlayers.svelte:187`), a live region announces the selection (`:259`), and there are "Inspect a period" (`:223`) and "View exact time data" (`:261`) controls. I drove it in the preview: the arrow keys and Home moved focus and updated the announcement, and the 30-day table showed 31 rows, with dashes before history and "History begins" on the first recorded day.
- [x] **Docs.** `metrics.md:86` adds a "Players over time" section covering both series, the filters, the gaps, retention and the API fields.
- [x] **Tests.** `metrics-players.test.ts` covers each listed case, plus the boundary rules and the no-history state. The migration, refresh, report-worker and page tests cover the rest.
**Review notes**
- Good extra catches:
- Migration 16 (`revisions.ts:4-22`) adds an index on `leaderboard_players(guid, first_seen_at)` for the per-row lookup.
- It also refreshes the cached report when a participation's timestamps change, since per-period counts now depend on `last_seen_at`.
- The method note says that players already playing when recording began count as new.
- In the same staged preview used for this issue's screenshots, the real chart gives the same totals as the mockup and a direct SQL count: 104 unique and 70 new over 7 days, and 32 and 11 over 24 hours. The 30-day view leaves the periods before the fixture's 27 September history start empty.
- The 8 affected test files pass locally (129 tests), and `npm run check` is clean. [Run 857](https://gitea.thewrightserver.net/josh/electric-cherry/actions/runs/857) passed on this commit (218 files, 2,880 tests). As in run 856, `migration-memory.test.ts` started after every other file finished.
Blocking a user prevents them from interacting with repositories, such as opening or commenting on pull requests or issues. Learn more about blocking a user.


Metrics shows lobbies, player-hours and matches, but not how many different people played or how many were new. The leaderboard already records both, so a players line chart for the selected range (24 hours, 7 days or 30 days) can be built from data we already keep.
MetricsChart.svelte:132"Lobbies running over time" is the page's only trend chart. Players appear only as player-hours in its selected-period summary (MetricsChart.svelte:237).metrics.ts:280-292readsleaderboard_match_playersonly to count participants per match for group size. Nothing counts distinct players across matches or periods.schema.sql:61-80storesfirst_seen_atandlast_seen_atfor each player in each match. That's enough to place a player in every hour or day they played.leaderboard-ingest.ts:140-144setsleaderboard_players.first_seen_aton a player's first event and never changes it.retention.ts:144-152expires matches (their players cascade) but notleaderboard_players, so an expired match can't make a returning player look new.player-profile.ts:30already treats one GUID across T5 and T6 as one player (MIN(first_seen_at)across games). New-player counts should use the same identity.#20's closing comment suggested "an additional graph to show on the metrics page. Perhaps for global player count". Unique and new players are the two numbers that show whether the player base is growing, and whether a busy day was regulars or newcomers.
Two limits should show on the chart instead of being plotted as zeros or added up:
leaderboard-ingest.ts:212, "older games are gone"). Live's earliest match is from 18 September (GET /api/matches), so today's 30-day range starts 8 days before any player history, and on the first recorded days every player counts as new.Screenshots
Same synthetic fixture for all shots. The fixture reuses one pool of 80 players, so I reassigned match participants in the disposable fixture database so returning and first-time players mix (142 players, 5 to 17 new per day), and rebuilt
leaderboard_playersfrom those participations the way ingest records it. Lobby samples are simulated as in #137.Before (7 days):

After (mockup), 7 days:

After (mockup), 24 hours:

After (mockup), 30 days. The fixture's player history starts on 28 September, so earlier periods are a gap with a note rather than zero players:

After (mockup), phone (390×844):

Fix
uniquePlayersandnewPlayersto each metrics period, using the lobby chart's periods (hourly for 24 hours, 24-hour periods for 7 and 30 days,metrics.ts:108).first_seen_attolast_seen_at) overlaps, once per period however many matches they played.leaderboard_players.first_seen_atacross games.MetricsChart.svelte:319).docs/guides/metrics.md.Reviewed
e3e740cea3. All ten fix items are done, so I'm closing this.Checklist
readPlayerMetrics(metrics-players.ts:5-87) fillsuniquePlayersandnewPlayerson the lobby chart's ownpoints, so 24 hours uses hourly periods and 7 and 30 days use 24-hour periods.leaderboard_match_playersrow adds its GUID to every period itsfirst_seen_attolast_seen_atspan overlaps, using a set per period (metrics-players.ts:62-79). Theit.eachtest checks a span across a boundary and two matches in one period for all three ranges.leaderboard_players.first_seen_atacross games (metrics-players.ts:50,68-69). Ingest writes both columns from the samereceivedAt(leaderboard-ingest.ts:166-188) and is their only writer, and the backfill replays through it (leaderboard-ingest.ts:234), so the comparison holds for real data. The retention test confirms that deleting a player's old match doesn't make them new again.metrics-players.ts:36-43). The cross-game test covers each game, each map, T6 variants and a missing map.players.uniquePlayersandplayers.newPlayersare separate sets across the whole range (metrics-players.ts:60-61,86). The test confirms the period values add up to more than the total.MetricsPlayers.sveltesits right after the lobby chart (+page.svelte:308) and renders even without occupancy samples. It has both lines, the range totals (MetricsPlayers.svelte:119) and hollow markers for partial periods.null(metrics-players.ts:14-26), the lines break there (metrics.ts:4in$ui), and a note gives the start date (MetricsPlayers.svelte:142-150). Using the earliest retained match also covers match retention shorter than the range.MetricsPlayers.svelte:187), a live region announces the selection (:259), and there are "Inspect a period" (:223) and "View exact time data" (:261) controls. I drove it in the preview: the arrow keys and Home moved focus and updated the announcement, and the 30-day table showed 31 rows, with dashes before history and "History begins" on the first recorded day.metrics.md:86adds a "Players over time" section covering both series, the filters, the gaps, retention and the API fields.metrics-players.test.tscovers each listed case, plus the boundary rules and the no-history state. The migration, refresh, report-worker and page tests cover the rest.Review notes
revisions.ts:4-22) adds an index onleaderboard_players(guid, first_seen_at)for the per-row lookup.last_seen_at.npm run checkis clean. Run 857 passed on this commit (218 files, 2,880 tests). As in run 856,migration-memory.test.tsstarted after every other file finished.